Your storyboard should not be a a dry report but an active document that truly makes your project come alive! Storyboarding has become a popular way of transferring the details of a Six Sigma project to a graphical representation. Very much like your child’s fifth grade science fair project. The purpose of course it gives the Six Sigma team a way to summarize their efforts and let other people outside of the team understand their efforts. On the Lean side, I think that is why A3 reporting has become so popular. It is a graphical way of displaying the project. Though we are all not visual learners the majority of us find learning by stories and pictures and diagram much easier.
“The first storyboards were originated in the Disney animation studios in the 1930’s. According to Walt Disney, the storyboard was invented by Web Smith, an animator and one the first story men at the studio. When Web planned a story, he would draw it instead of describing the action in words. At first he simply spread the drawings out over the floor of his office, but soon graduated to pinning them in order on to the walls. In this way, the unfolding story gains the valuable visual dimension. According to legend, Walt was none too happy with the innovation. He had just redecorated the offices and the marred walls in Webb’s office stuck out like a sore thumb. But Walt also recognized the order imposed by the posted drawings and the ease with which the entire feature could be analyzed and manipulated. So he ordered 4′ x 8′ corkboards and the storyboard was born.
Soon, every Disney cartoon came to life on the storyboard, and the board themselves moved to new departments as the project progressed. The story men would pitch their ideas to Walt on storyboard, color and sound were both added using the storyboard as reference point, etc. When Walt hijacked the studios innovators to design the attractions for Disney land, they brought the storyboard along with them. And today, it has evolved into a standard technique among the Imagineers.”
I think there should be a happy medium somewhere between the Disney storyboard and the Six Sigma storyboard. However, if you error, error toward the Disney side.
As many of you already know, the PowerPoint presentation was developed by engineers for exactly the same reason that most develop a Six Sigma storyboard, to tell the story of a project. However, the main purpose of a storyboard is to tell others outside of the team the story and maybe more importantly to depict to others what is going on inside the project as it is unfolding. Try hanging your Storyboards in the hallway or cafeteria much like the trophy cases in a school. You may be surprised on the amount of activity and comments that it may stimulate. Ask for comments by putting a suggestion box or post it notes next to the storyboard. Get people engaged in the planning process not just at the end.
You may create the typical PowerPoint utilizing SIPOC, VOC, House of Quality and other Six Sigma or Lean Tools. If you are on the team ask yourself, how will you get others engaged? Consider your audience, the storyboard is not about you it is about them. Take a lesson from Disney or even have your fifth grader help you on this project. For example, using a DMAIC process, below are some simple guidelines on how to develop an entertaining storyboard.
Define the problem: What is the first thing you learned in 5th grade about writing a story? You have to have a hook! Appeal to the emotions of your audience!
Measure: Your metrics must clearly define the problem and visually display it. Do not limit yourself here to simple metrics; maybe pin the defect on the wall or the cause. If a failure causes a catastrophic condition, display visually what that means.
Analyze: Create some drama in analyzing the problem. A typical process here would be identifying the vital few metrics that are important. Create some drama in finding the root cause. Think about how if you don’t find the real problem what may happen.
Implement: We have taken the story to the critical stage, there has to be a solution. This is where everyone wants to jump in and help. We are all problem solvers but are we all MacGyver’s? We have to find the best answer that addresses root cause and is measurable. Who will be the Hero?
Control: Now, is the time of the story that the problem is solved and life goes on happily ever after. Can you depict that in your storyboard? Can you show and prove the results that prove this? Did you reach the other side of the rainbow?
Creating a compelling presentation that depicts the story accurately and allows others outside the team to participate is extremely important. Remember, your storyboard should not be a report but an active document that truly makes your project come alive!
Great article which points out
Core principles that we can all learn from Disney:
- Know the story is king.
- Utilize the newest technology to tell that ancient story in a new way.
- Coordinate the message across the media.
- Have the courage to innovate.
- Ride your uniqueness.
- Stay on message.
“We can draw wisdom from Walt Disney, who understood the multi-media, multi-channel, multi-experience world four score years (what are you thinking of now?)”
Read his article but more important in this world of “Change” take ownership of the word that describes your organization and you will live through it. Do you question what Disney stands for when you see the Castle.
A Storyboard provides a quick, visual summary of a team’s work. They are very well suited as presentation materials to highlight the work of the project, the improvements made and for executive overviews. I recommend having a storyboard created before closing the project. The mindmap below is a simple outline of a storyboard. Depending on your project you may use a different set of tools but the outline can still serve as a guideline for what should be included.
The definition of an A3 Report is a simple storyboard that tells the whole story of an improvement event on one 11×17 sheet of paper. The left side defines the problem, the right side proposes solutions. That is the basic structure. However, A3 is much more than that. It is the tool used by Toyota to implement the PDCA process. Understanding A3 thinking and you can apply this to problem solving, proposals and status reports. But you have to pick a template and you have to follow some outline in creating an A3 to get it off the ground.
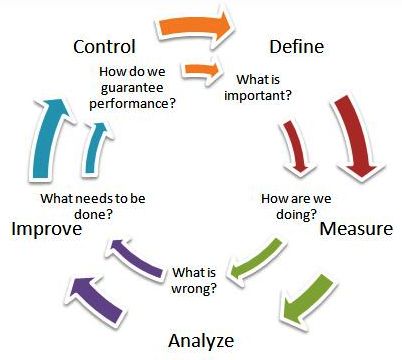 Typically, when I create an A3, I go about it a little differently by utilizing the Six Sigma principles of DMAIC. This acronym stands for Define-Measure-Analyze-Improve-Control. The Six Sigma process improvement process(DMAIC) is closely related to the PDCA lean process. The difference is the set of tools being utilized. I believe DMAIC has a stronger set for variation and process control. The PDCA process has a more simplified version. Depending on your needs either tool applied appropriately can be utilized. Lean has a tendency to be favored initially because of the lack of measurements within most organizations and that process is a little more forgiving. The important part is that you start the process. The chart simplifies the DMAIC process:
-
Define -What is important?
-
Measure – How are we doing?
-
Anaylyze – What is wrong?
-
Improve – What needs to be done?
-
Control – How do we guarantee performance?
Whether you decide to use DMAIC or PDCA for your A3 makes little difference. The tools are just that, tools. The important part is that you have flexibility to format your A3 report in any way that most effectively can tell and demonstrate your story to your team and others. Your goal is not to complete the A3 report, it is to harness all of the benefits through implementation from the problem solving that took place.
I use A3 Reporting in the marketing process. It demonstrates and recaps the thoughts, efforts and actions that took place for a particular campaign, such as advertising or public relations or even a launch. This report can really highlight the value that marketing supplies. I will be discussing DMAIC and A3 and how it applies to the foundation of the Lean Marketing House™ in the upcoming weeks.