In the previous exercise, I just discussed the Measure phase of DMAIC and wanted to let you in on something, I left a little bit out. I think the average person hates math, especially marketing people. I only gave you a slight introduction, mostly for you to evaluate the process. Even if you only use “Tribal Knowledge” you will be better off going through the exercise. To get “Six Sigma” results you do have to measure and use statistical data, but to improve your processes, you can simply use Tribal knowledge, to an extent.
However, I will warn you, Tribal knowledge is not always correct. Observation of the numbers, without proper analysis, seldom works. You would be amazed at some of the scenarios I have seen where the obvious data does not work out to the obvious answer. But on with the show and how do you analyze something.
Typically, great discussion takes place on what should be measured. Make sure whatever you do has impact on the customer. You have a process map at your disposal; a set of measurements, so pick the one you understand best and there is an obvious problem with. This will make it simple rather than just trying to improve on the process.
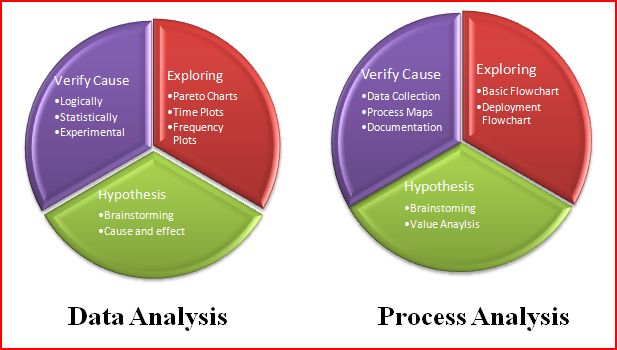
You have two basic analysis to do, process and data. You can more than likely analyze either one first or even have separate parties do each. Remember the purpose of the analysis is to find the root cause of the problem. You will use these three steps, Exploring, Generate Hypothesis, Verify Cause. Support your decision utilizing one of the tools listed in the chart. There are more advanced steps, but this will give you a good foundation to start.
Some people make a few assumptions and go directly to the implement stage. One of my suggestions would be, if you did that, to at least experiment with your decision and analyze what change takes place. Testing is a big part of marketing and seldom used enough.
Data Analysis Tips:
-
Choose something that has different customer, segments, technologies, economics, etc. that are isolated. This way they will be easier to monitor the results.
-
Represents a significant or growing proportion of cost
-
Prioritize your objectives in price, speed, quality, service, etc.
Process Analysis Tips:
-
Processing time: the time actually worked on the job
-
Queue time: the time a job is waiting for the next operation
-
Wait time: the time a job is waiting on other parts of the process
-
Transport time: the time a job is in transit
Only processing time adds value, the other time elements should be reduced or removed.
Is this really possible to do in marketing? I think not only possible but mandatory in the coming years. And with the tools that are becoming available as we move further into the electronic age data will get easier to manage. Right now, we have more data than we know what to do with, but how are we analyzing website traffic or open rates, etc. Sophisticated analysis is becoming available to the masses. The understanding and implementation of this data is what will be imperative to have. Now you get to go to the Improve step.
The start of this series of Posts was on How Much Value You Can Provide
: DMAIC , Lean , Lean SixSigma Marketing , Market , Marketing , Six Sigma
All points are well taken. I only differ with one, you should look at long existing processes and the data they yield, quite often they yield information which can bring about significant changes.
I have to agree with you. Also, the data is more reliable.